Dashboard
The dashboard's interface is designed for the simple flow of picking a website and immediately drilling into the numbers you care about.
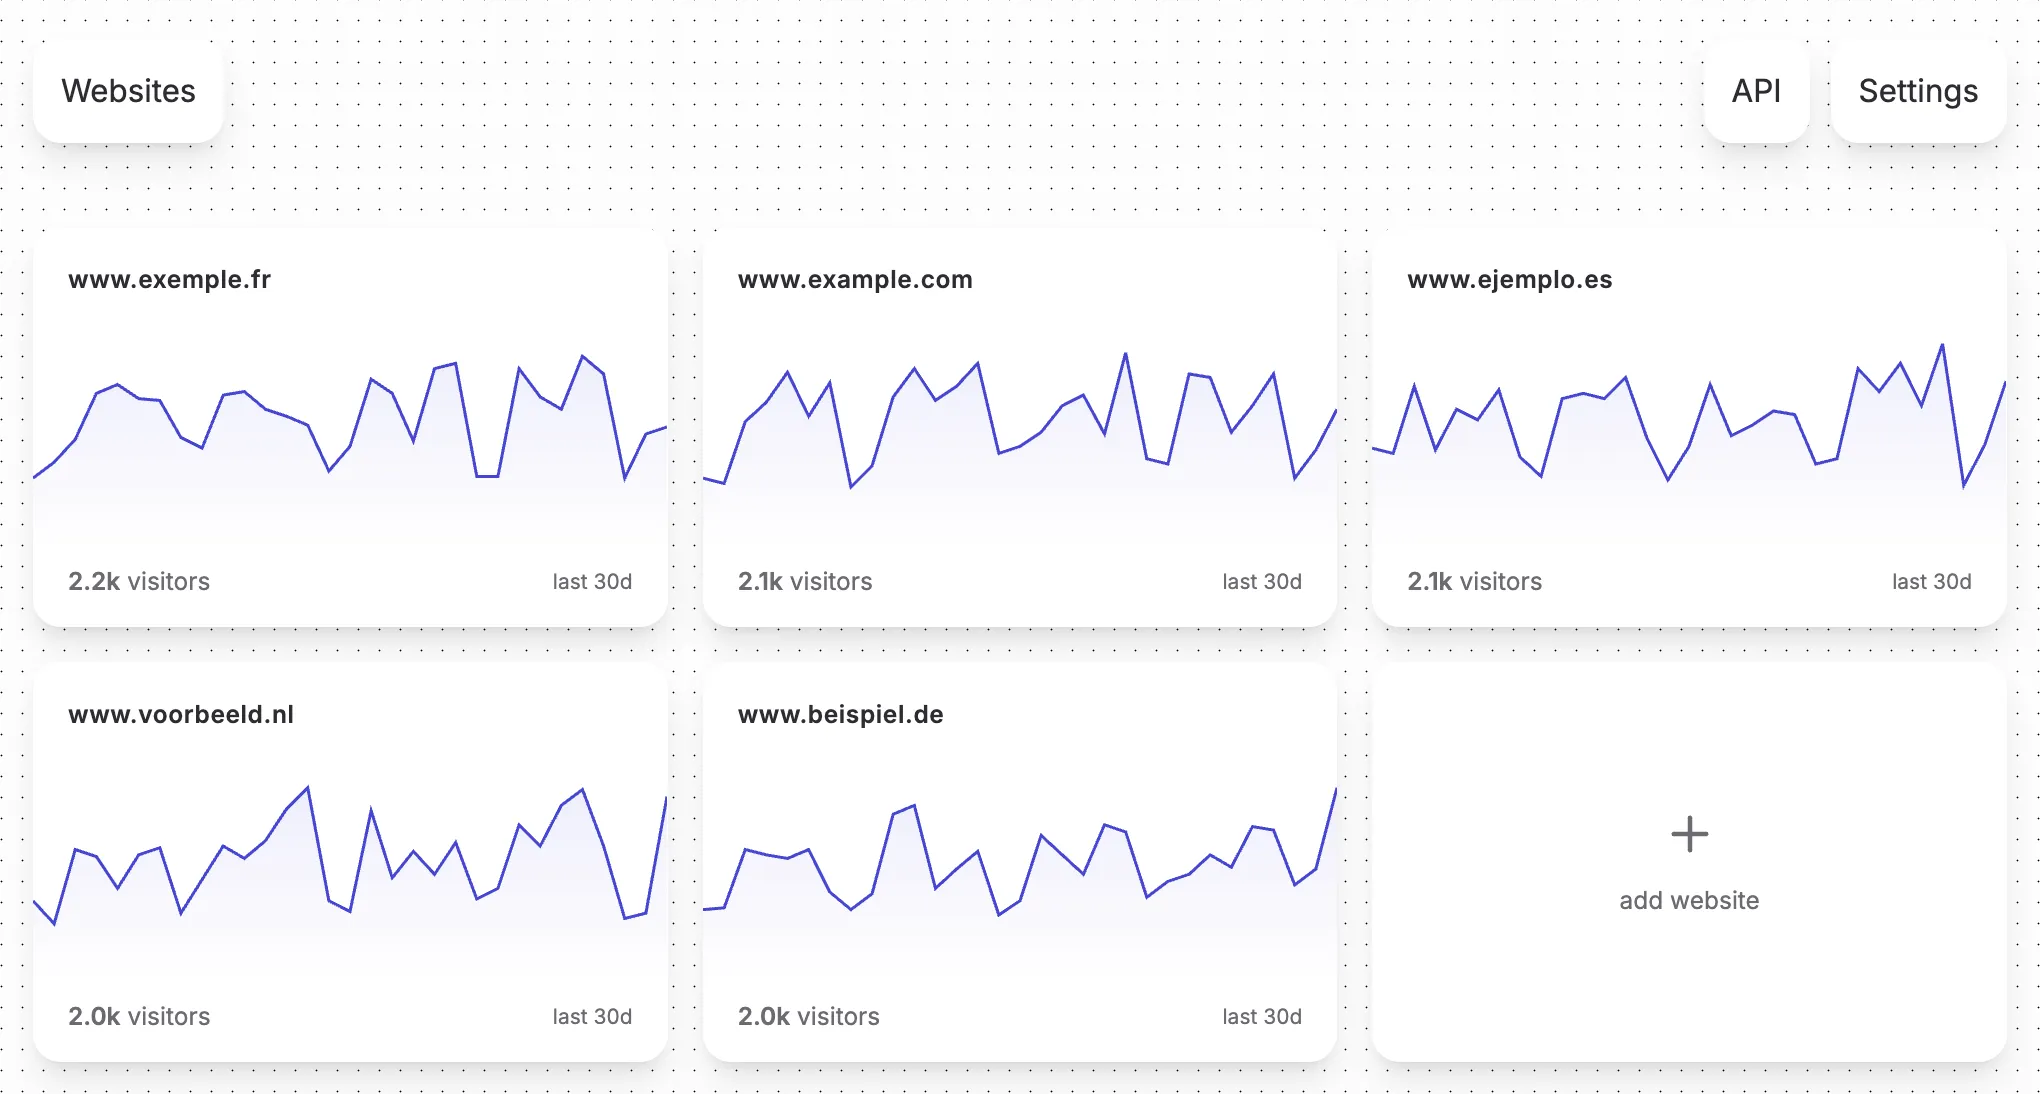
Visage lets you track analytics for any number of websites.
Aggregate stats
The top of every website dashboard shows four aggregate numbers:
- Total visitors: unique first-time pageviews in the selected period
- Total pageviews: every pageview in the selected period
- Median time on page: the median time visitors have spent on your website
- Live pageviews: any pageviews which were triggered right now, or just a few moments ago
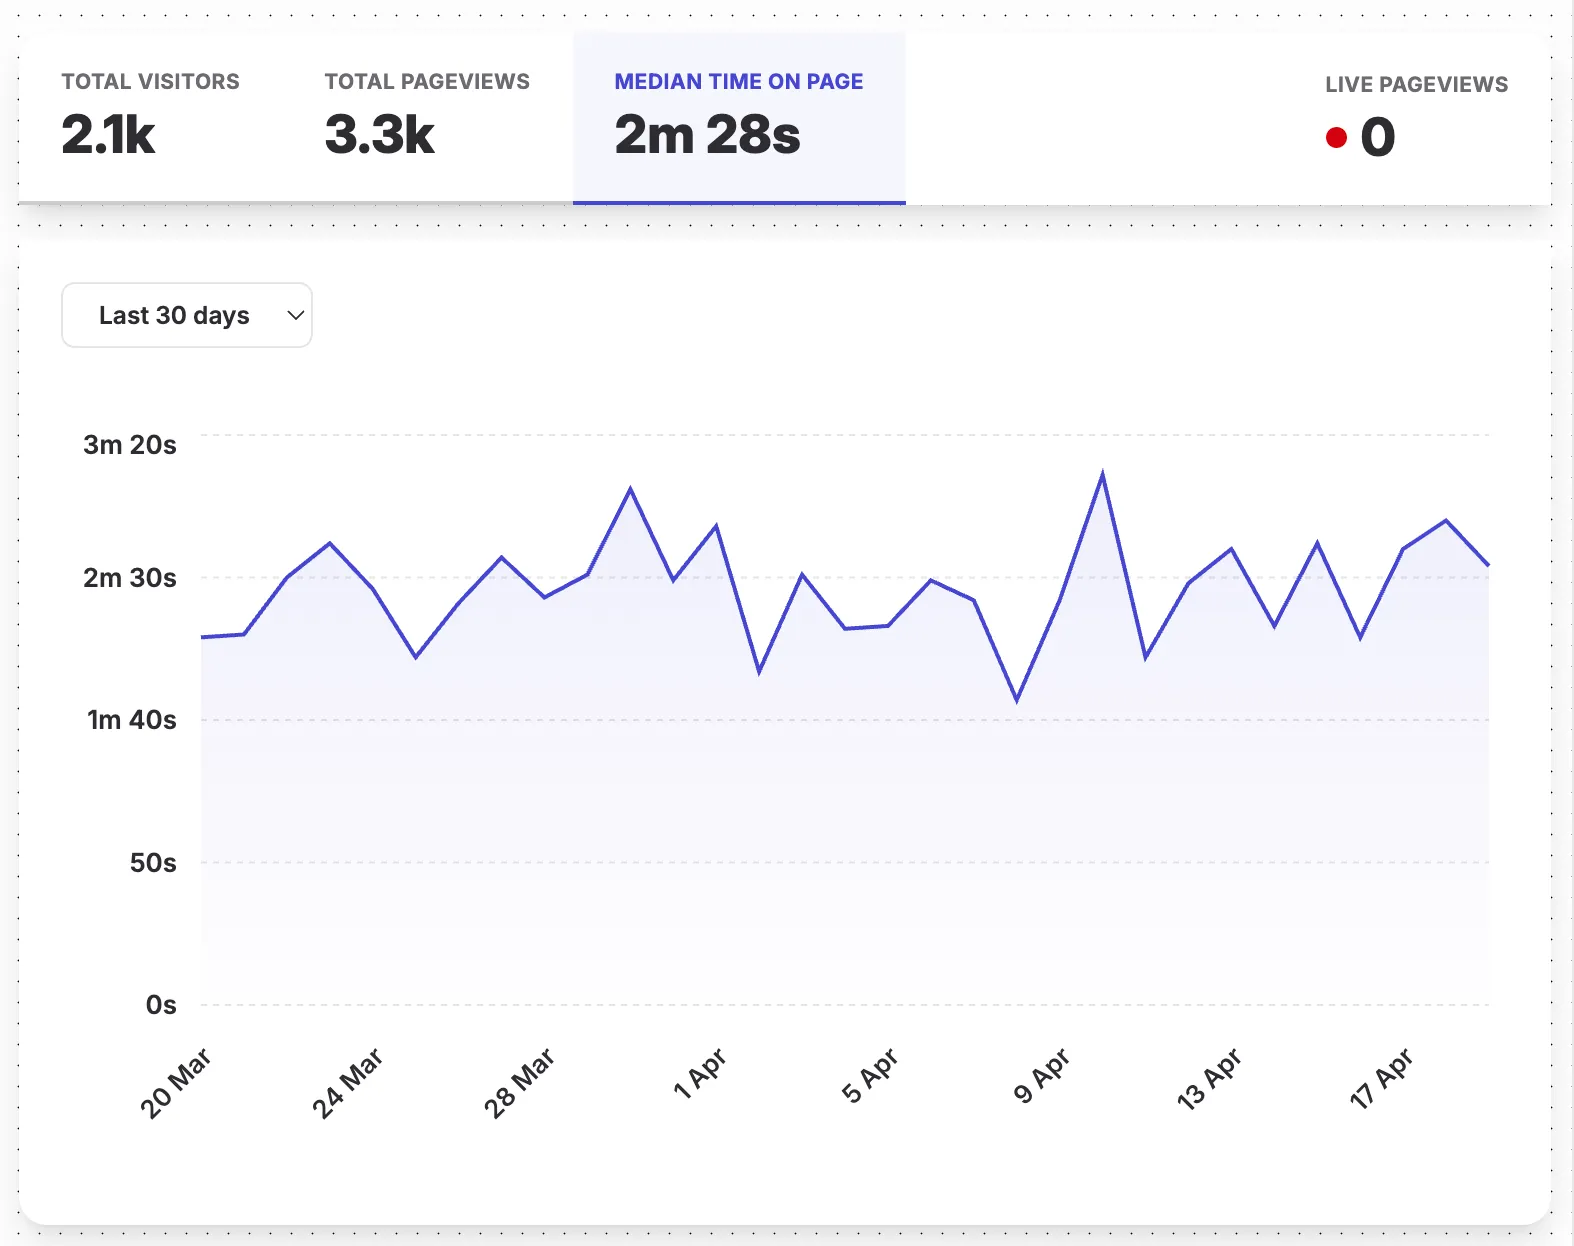
Clicking any aggregate stat swaps the main time-series chart to graph this particular metric.
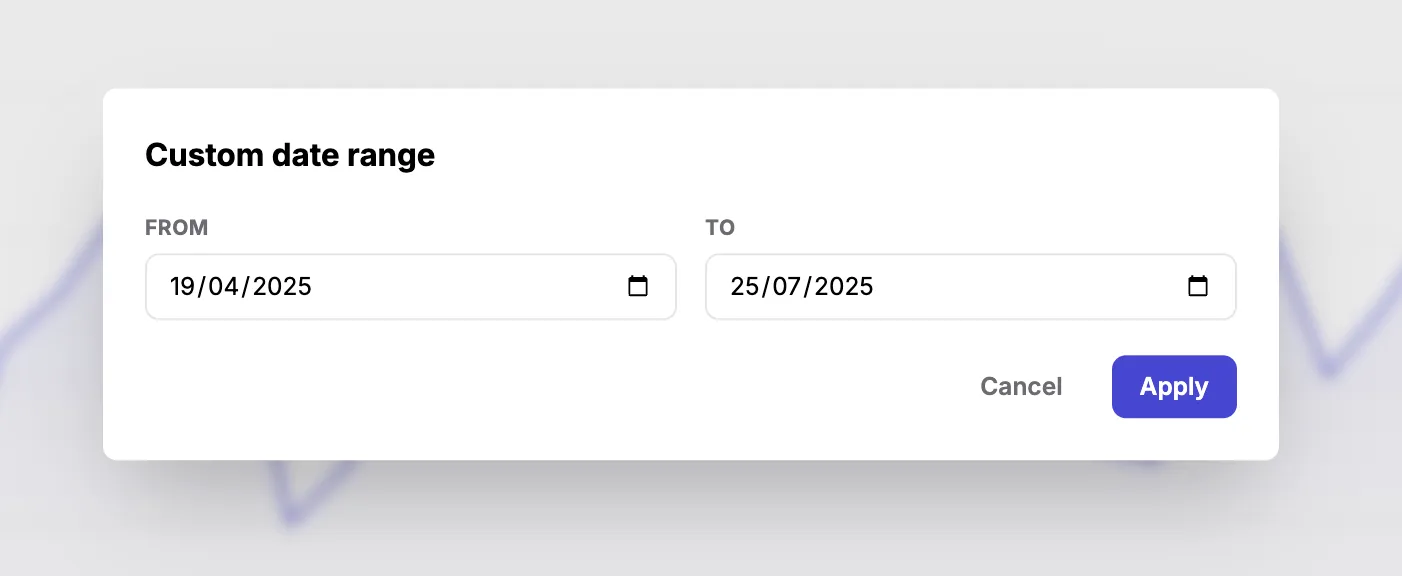
Periods
A period picker sits above the time-series chart, letting you switch between preset periods (today, last 7 days, last 30 days, etc.) or define a fully custom range. All numbers on the page recalculate when the period changes.
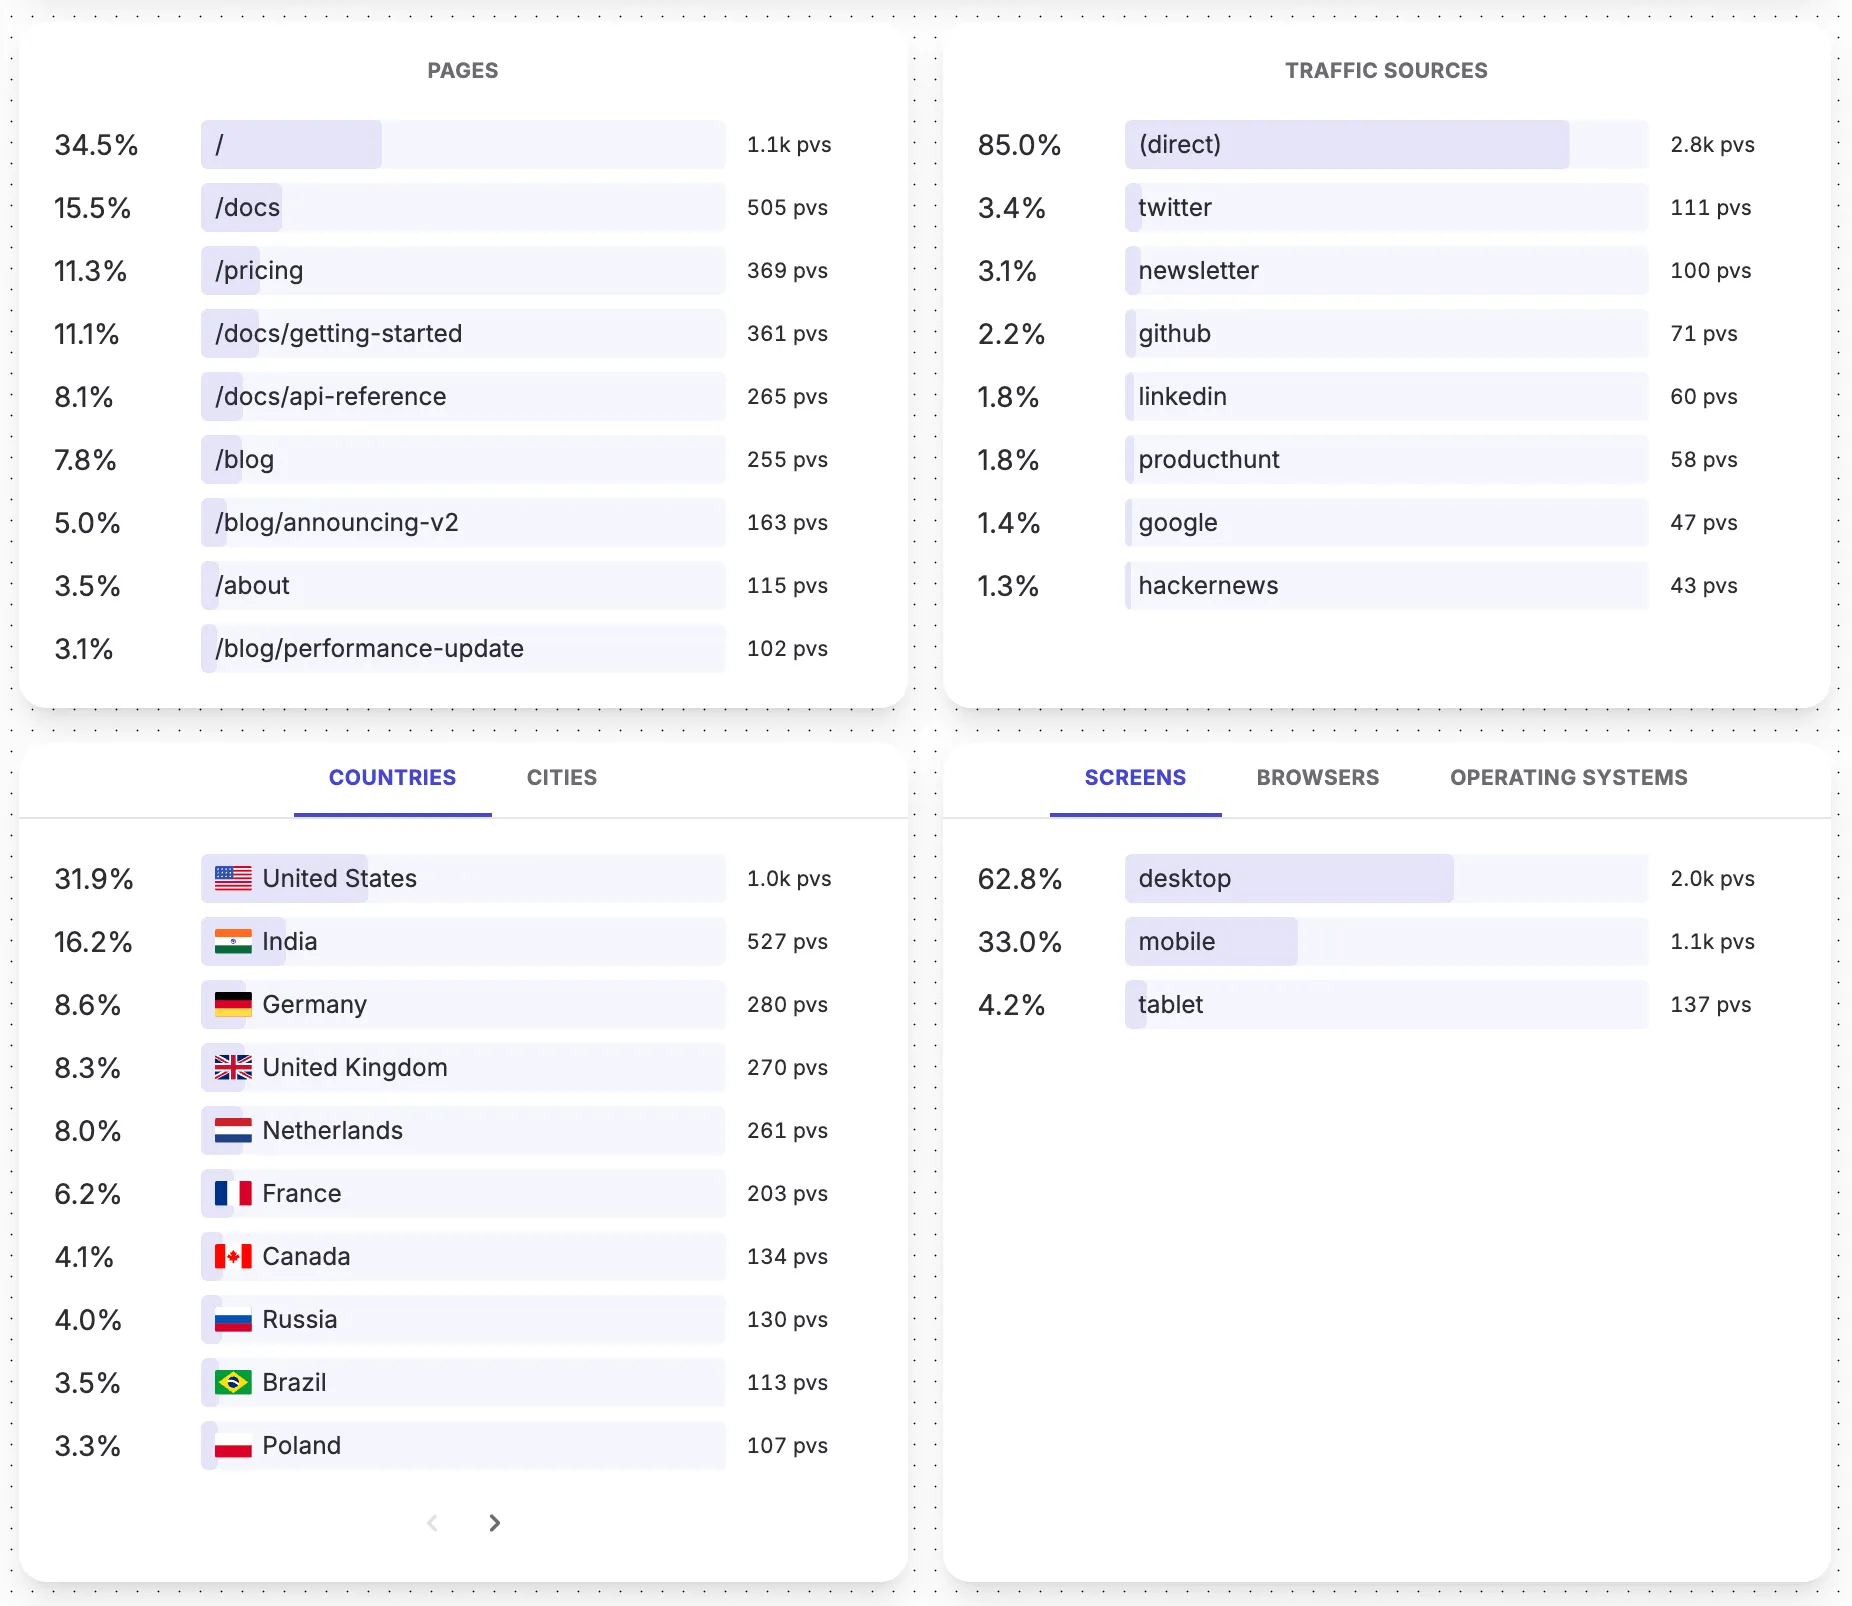
Filters
Filters are applied by clicking any of the traffic distribution values. For example, clicking a country narrows every chart and every other distribution to just visitors from that country.
The current period and filters are reflected in the URL, so you can share a specific view by copying the link.